The market quotes a price.
The panel quotes one back.
Open a Polymarket Up/Down market or a Kalshi crypto ladder and the side panel prices the same question independently: a probability from a documented model, next to what the order book is charging for it, updated live. It reads. It never trades — it cannot place an order, connect a wallet or touch an account, and it never asks for one.
In review at the Chrome Web Store. The build is finished and submitted; until Google approves it, the install link isn't public. Early subscribers get access the day it lands — and the track record it is built on is already public, no account needed.
what you are looking at
This is the panel itself — the same markup and the same styles the extension ships, not a mockup. Every number on this page is one archived window: BTC 15m, 5 August 2026, 14:45 UTC, frozen at two minutes thirty-four from expiry. It is the window the home page replays tick by tick, and it resolved UP.
- The pill — one glance at every input: resolution feed, how many of the five exchange sources are alive, whether the order book is streaming, whether the exact price to beat was recovered, and whether server metrics are connected.
- The clock — an input, not decoration. σ scales as √t, so the last ninety seconds move the probability more than the first ten minutes.
- The colour — the whole panel takes the hue of the side with the edge, and its intensity follows the size of that edge. Green here means Up, and it is bright because 20.7 points is a large disagreement.
- Everything is foldable — distribution, volatility and settings ship collapsed; the panel opens on the three cards that matter and remembers what you open.
card by card
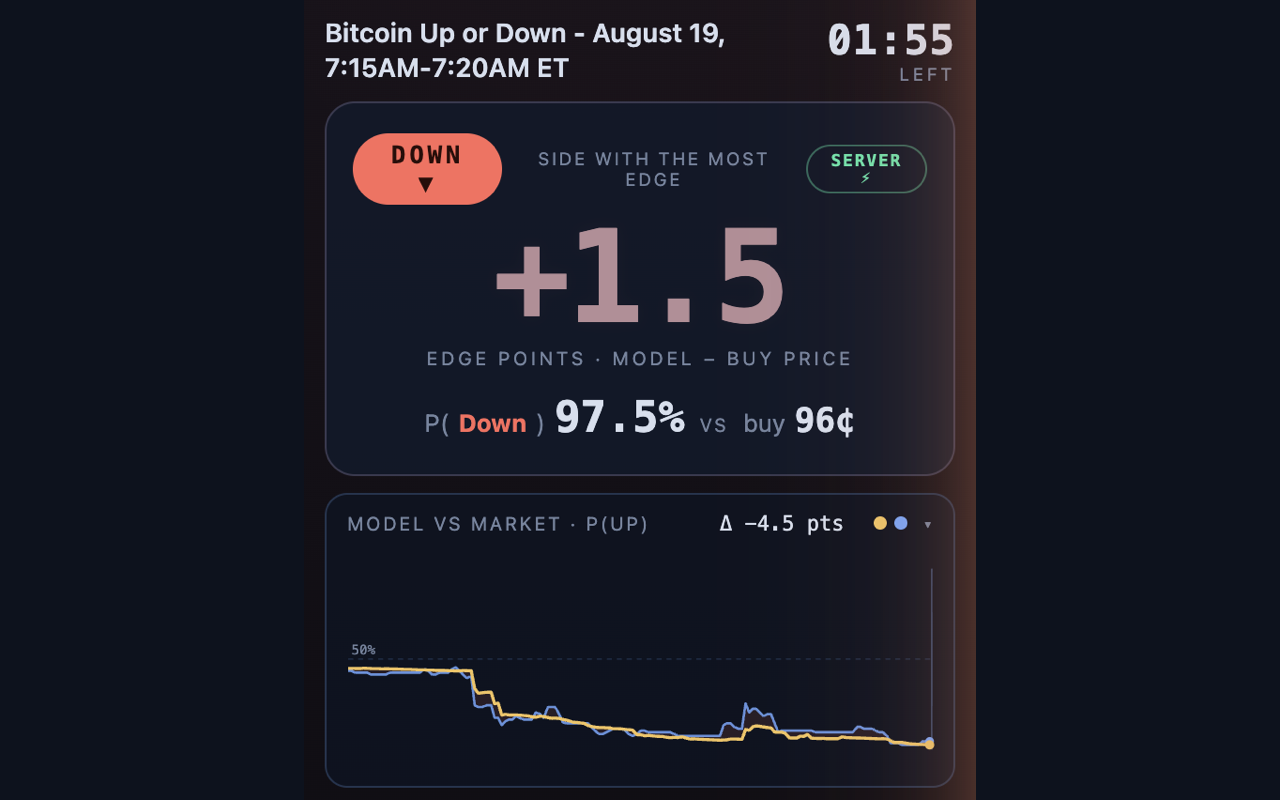
Executable edge, in probability points
The big number is the model's probability minus what it costs to buy that side right now: the ask, spread included, not the midpoint. It is the only version of the number you could have acted on. Here the model says 81.7% and the offer is 61¢, so the edge is +20.7 points — while the gap to the book's midpoint, shown on the card below, is 21.2. The difference is the spread, and pretending it doesn't exist is how backtests lie.
The chip picks the side with the larger edge and the panel follows it. Under about two points, the number is inside the noise of estimating volatility, and the panel says so rather than dressing it up.
SERVER ⚡ = Pro With a Pro session, the headline stops being computed in your browser and starts streaming from our engine — the same numbers we paper-trade and publish every night on /performance. Free keeps the model probability; the executable edge is the paid half.
Both estimates, for the whole life of the window
Two probabilities of the same event over time: ours in amber, sampled once a second, and the market's — the order book midpoint — in blue. The shaded area between them is the disagreement, and its colour carries the direction.
The curve above is the real one from the archived window. For eleven minutes the two lines are on top of each other, never more than six points apart, because a liquid book is fast and mostly right and we say so. Then spot turns, our estimate turns with it, and the book stays priced for a move that already finished. The header keeps the current gap — Δ +21.2 pts — visible even when the card is folded.
Five books, one price, and how far ahead of the feed it is
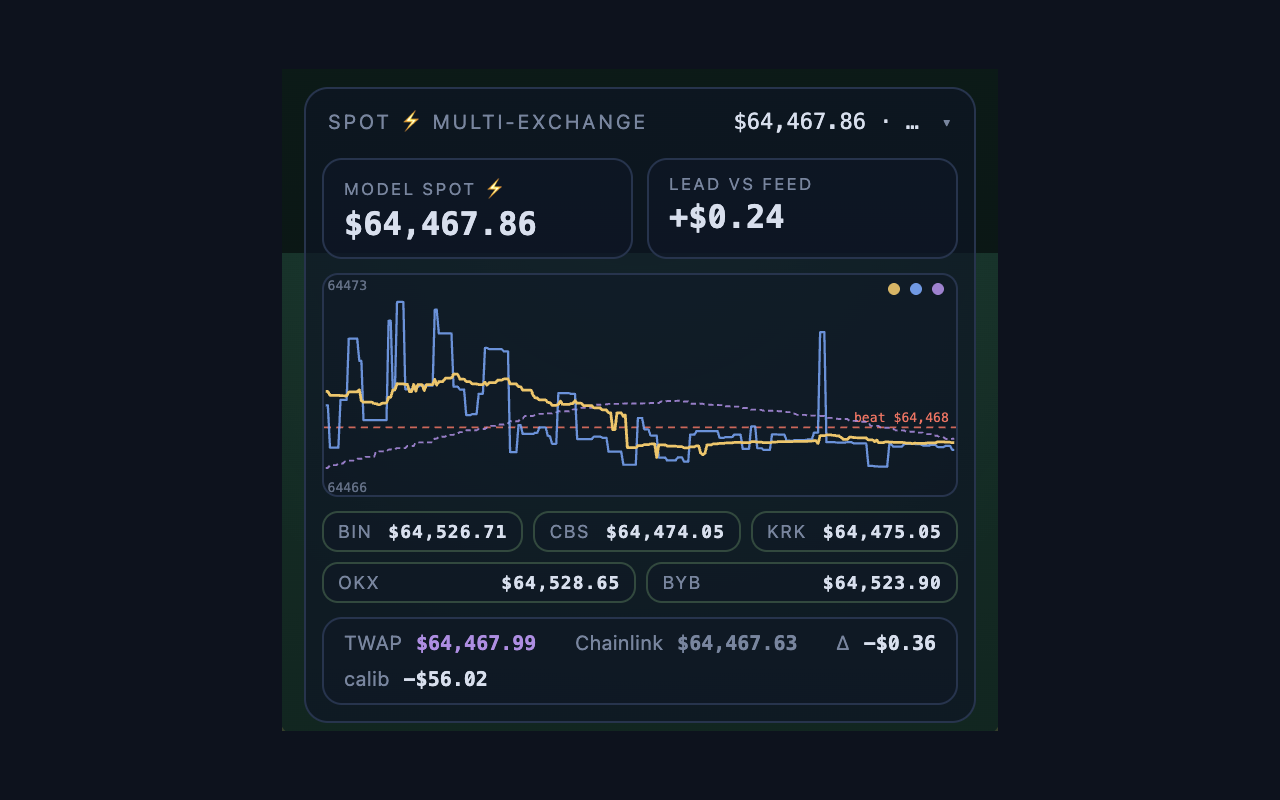
The market resolves against a single published feed, and that feed is a relay: it summarises venues it is slower than. So the panel reads five exchange books over direct websockets — Binance, Coinbase, Kraken, OKX, Bybit — at roughly a hundred milliseconds each.
The five quote in different units: dollar-pegged tokens on some venues, actual dollars on others, tens of dollars apart. Each source therefore carries a per-source offset, an exponential moving average against the raw feed, applied before anything else; the composite is the median of the five corrected books, so one stalled venue moves nothing. The second tile is the lead — how far in front of the feed the composite currently sits — and it lights up when a move is happening on exchanges and has not reached the feed yet. The sparkline shows the last ninety seconds of both, with the price to beat as the dashed red line.
The window shown here pre-dates the 7 August 2026 switch to TWAP settlement, so its sparkline carries two series. On a market that resolves on the TWAP, a third line joins them in violet, dashed: the sixty-second average that actually settles the window, about thirty seconds behind the raw feed by construction.
the lead number is Pro
The shape the probability came out of
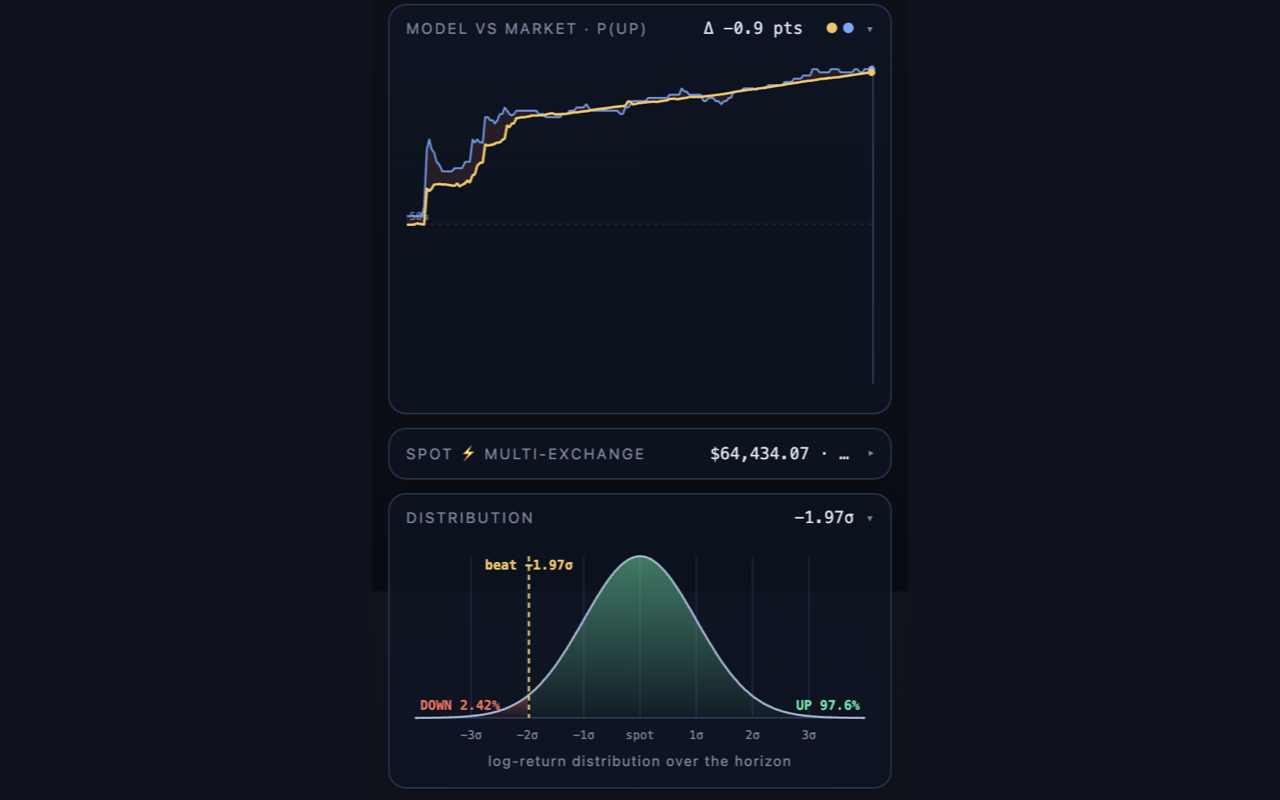
The distribution of the terminal move over the time that is left, with the distance to the price to beat drawn on it as a dashed line in σ. The green area is P(Up), the red one P(Down); they are the probability, not an illustration of it.
Switching the model to Student-t with ν=4 — renormalised so its variance still matches σ — visibly fattens the ends of this curve. Both curves agree to about 2σ and then part company by one to two orders of magnitude, which is exactly the region where a window nobody thought was live turns over.
Every input the probability was computed from
Spot as the model sees it, the price to beat, the distance in dollars and in σ, σ over the remaining horizon, annualised volatility with the candle window it used, the market's own implied probability, and the probability of the spot path touching the beat at least once before expiry.
Two conventions worth knowing. Distance σ is signed from the beat towards the spot: it reads −0.90σ here because the spot sits above the beat, which is the favourable side for Up — the dollar distance right next to it carries the plain-language sign. And P(touch) is indicative: it is twice the terminal probability by the reflection principle, computed on the spot path, while resolution rides a sixty-second average of a different series. The panel says so in its own tooltip rather than quietly presenting it as exact.
What the market assumes, against what actually happened
Invert the market price and you get the volatility the market is assuming — a binary-option implied vol. Put it next to realised volatility from one-minute candles and you can read the market's state of mind in numbers rather than vibes. On this window the book was pricing 189% annualised against 53% realised: it expected far more movement than the recent past, which is another way of saying it thought the move could still come back.
figures are Pro Free keeps the badge in the header, so you can see when implied and realised are far apart; the numbers themselves are paid.
| strike | P(y)% | buy y / n | edge |
|---|---|---|---|
| 64,000 | 89.0 | 82 / 20 | +7.0 |
| 64,250 | 70.4 | 66 / 36 | +4.4 |
| 64,500 | 44.0 | 47 / 55 | −1.0 |
| 64,750 | 20.1 | 24 / 78 | −1.9 |
| 65,000 | 6.4 | 12 / 90 | +3.6 |
An hourly ladder, priced strike by strike
Kalshi's crypto hourlies quote a ladder of strikes rather than a single Up/Down question. The panel prices every strike near spot with the same model and puts each one next to both asks — yes and no — so the side with an edge, if any, is the coloured one. Rows with nothing to say stay dimmed.
The probabilities in this example are computed from the model at the spot and horizon shown above; the asks beside them are illustrative — no Kalshi quotes are archived for this window. Kalshi's settlement source is not the one we calibrate the composite against, so the panel warns that sub-two-point edges there are noise.
The assumptions are yours to change
Normal or Student-t and its ν. The volatility window — automatic by market duration, or pinned to 60, 90, 120, 240 or 480 one-minute candles. Fast multi-exchange spot on or off, so you can see exactly what the composite is buying you. And an experimental short-term drift term, off by default, because very-short-term momentum is mostly noise and we would rather say that than sell it.
the same panel, live
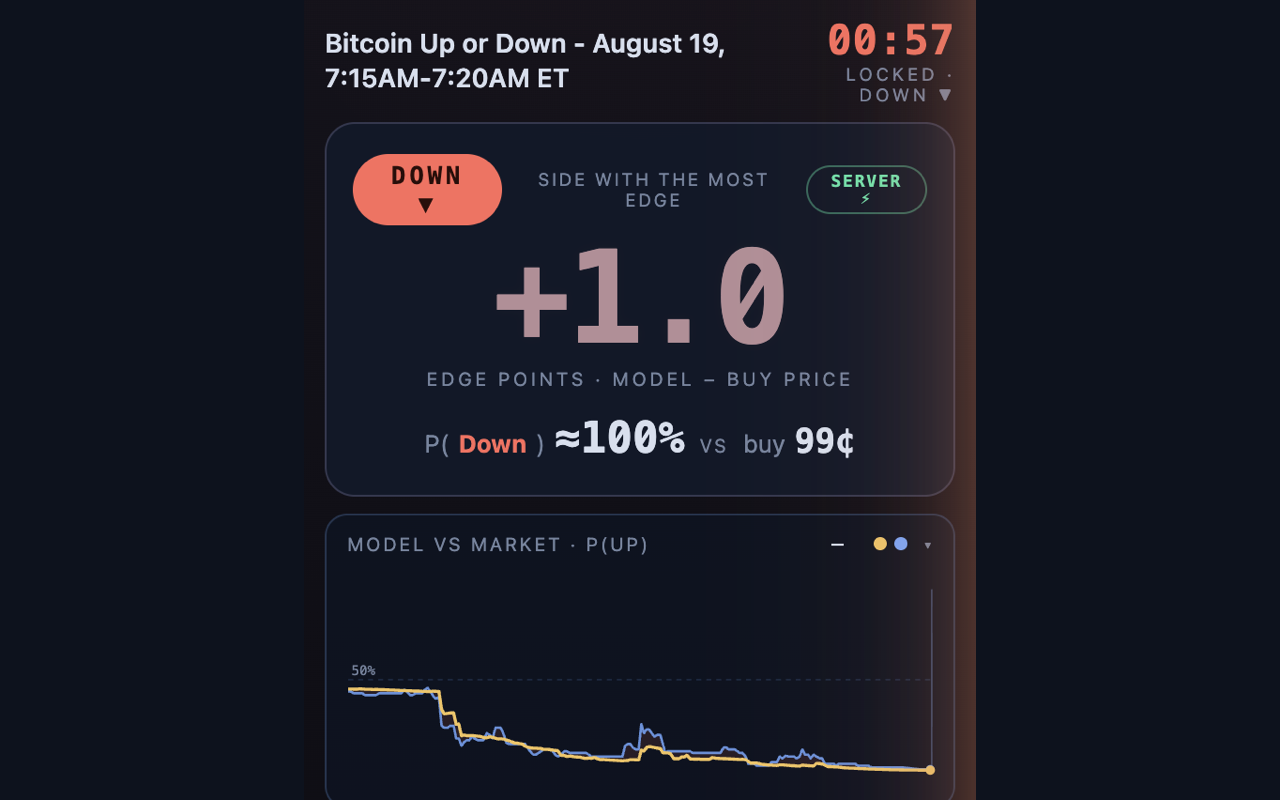
Four captures from the Chrome Web Store package, taken on live BTC windows on 19 August 2026.
how these markets actually resolve
On 7 August 2026 Polymarket moved its 5-minute, 15-minute and 4-hour crypto markets onto a sixty-second time-weighted average of the Chainlink price. Up wins if the TWAP at the close is greater than or equal to the TWAP at the open — not the last tick against the first tick.
That changes the maths, so it changed the model. The variable being priced is now the final sixty-second average, which is mechanically less volatile than a spot print: with more than a minute to go, the effective horizon is the remaining time minus forty seconds, and σ shrinks accordingly. Inside the last minute the average is already partly realised — the panel folds the ticks that have landed into a known quantity and prices only the unknown remainder, which is why a window can lock to a near-certain probability before the clock reaches zero. The panel shows all three series in the spot card: the composite, the raw Chainlink feed, and the TWAP that settles it, roughly thirty seconds behind by construction.
Hourly markets still resolve on the Binance hourly candle (close ≥ open), and the panel switches rule and feed with the market. The footer of the panel states whichever rule is in force, in full, on every window.
free and pro
| what you get | free | pro |
|---|---|---|
| Model probability, computed in your browser | yes | yes |
| Assets | BTC | BTC · ETH · SOL · XRP · DOGE · BNB |
| Executable edge (model − ask) | — | real time, server-computed |
| Implied vs realized volatility | badge only | figures |
| Multi-exchange composite lead | — | yes |
| Student-t tails | — | yes |
| Public track record | everything, no account | everything |
The Pro metrics are computed on our own machines and streamed to the panel, which is the point: they are the very numbers we paper-trade every night and publish with confidence intervals. A feature gate written in browser JavaScript would be theatre. €9.99 a month, or €79 a year — pricing. DOGE and BNB are panel-only for now; the nightly record covers the first four assets.
privacy, in one paragraph
No ads, no analytics SDK, no tracking, no browsing history. The panel runs on exactly two sites. Signed out it transmits nothing at all — the model runs in your browser. Signed in, it sends your session token so our server can confirm the subscription is active, and we do not store it. Full text: extension privacy policy.
before it lands
The extension is submitted and waiting on Chrome Web Store review. Subscribe now and you get access the day it is approved — and in the meantime the thing it is built on, the nightly record of what the model predicted and what actually happened, is free and public with no account.
The panel is a read-only viewer: it does not execute transactions of any kind, and it is not a trading venue. Not affiliated with, endorsed by or connected to Polymarket or Kalshi.